 Navigation
 Introduction
The BounceTogether Dashboard has been created to enable you to see the overall picture of surveys that are being completed around your School. From here, you can run comparisons to compare results of the same survey, the last time it was completed. And you can repeat this across all of your School, a year group or class. The Dashboard also enables you to filter the results based on different demographics such as PP, FSM, etc. Some of this functionality is demonstrated in this topic.
Load the Dashboard
To load up the Dashboard, you need to be logged in as a user that has permission. If you cannot see an option for the Dashboard then please see your Bounce Administrator.
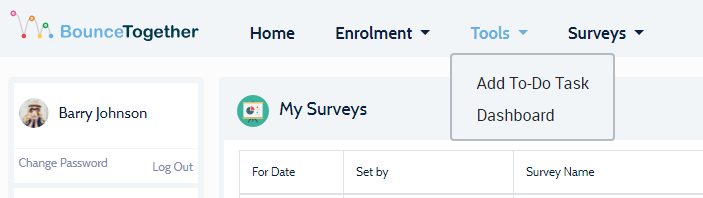
When logged in to the landing page of Bounce, click Tools / Dashboard
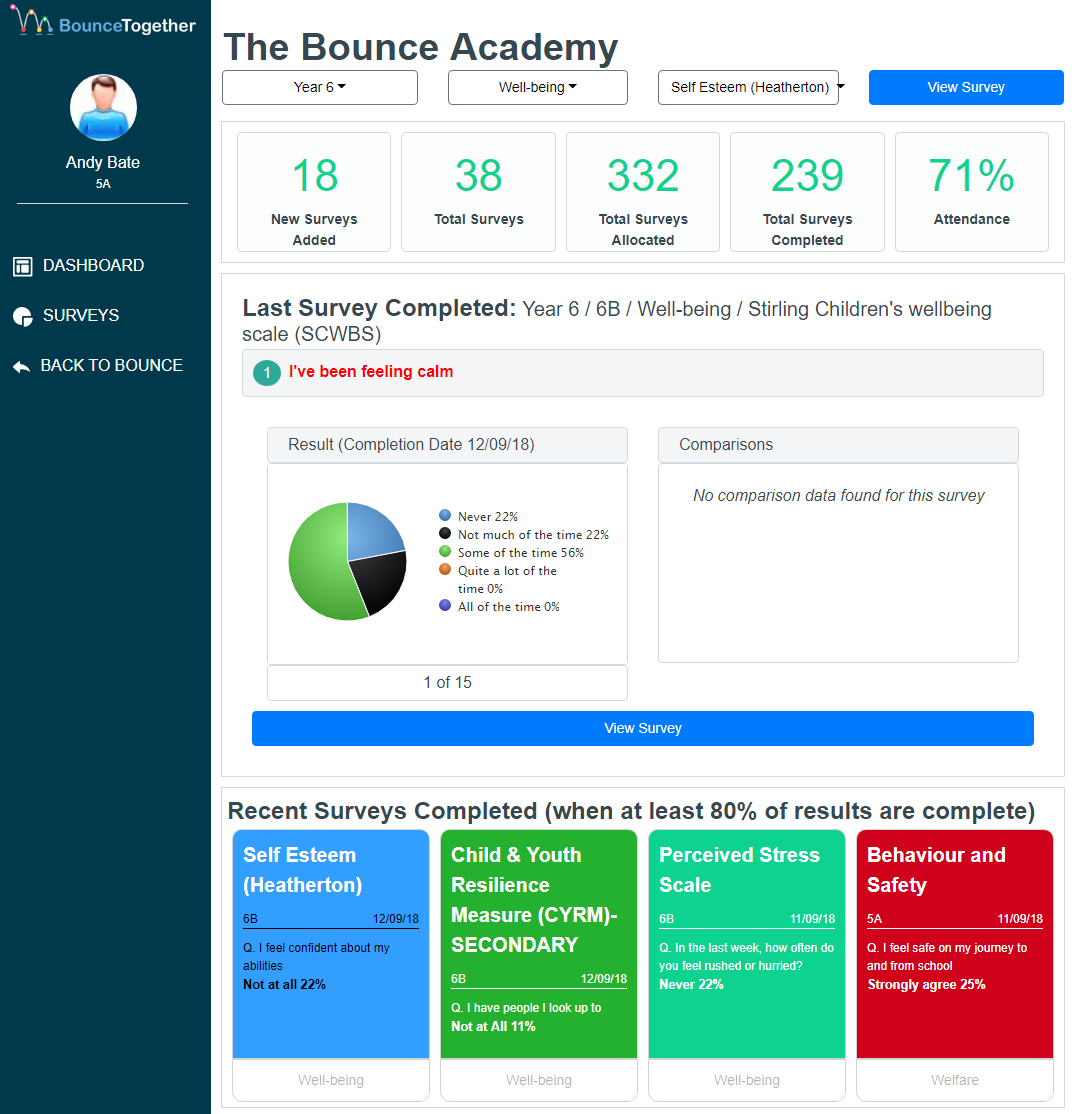
The landing page of the Dashboard will then open for your School, like shown in the example below.
Initial View
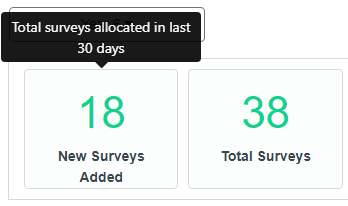
When you first load the Dashboard, you will see some information about the survey activity in your School.
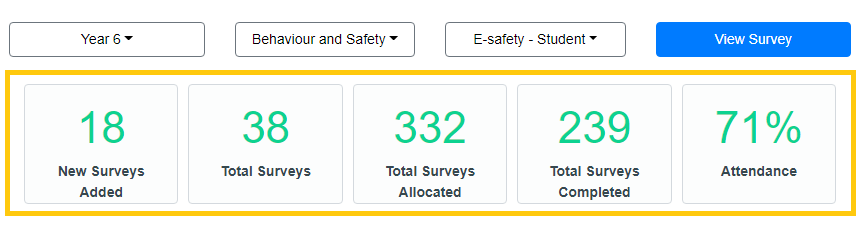
If you are unsure what they mean, hover your mouse over each of the numbers to view a description.
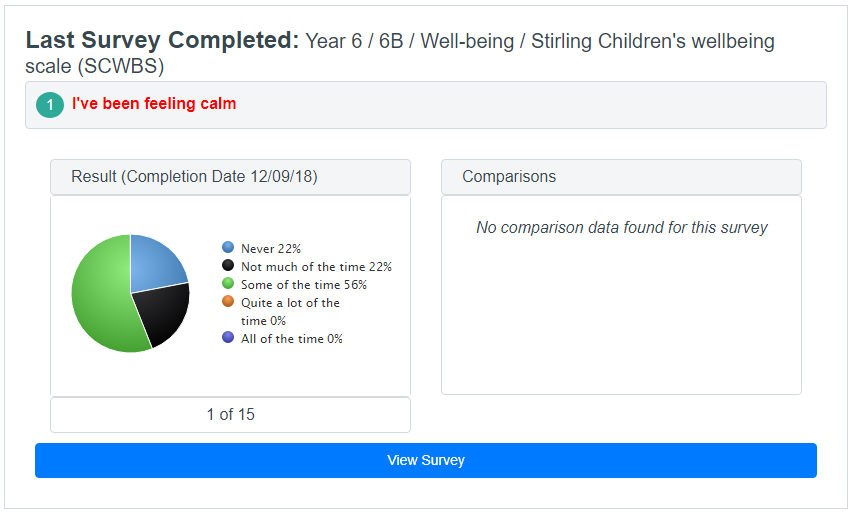
Underneath the statistics, you will see the last survey that was completed. If you want to view the full details of this survey, click the "View Survey" button.
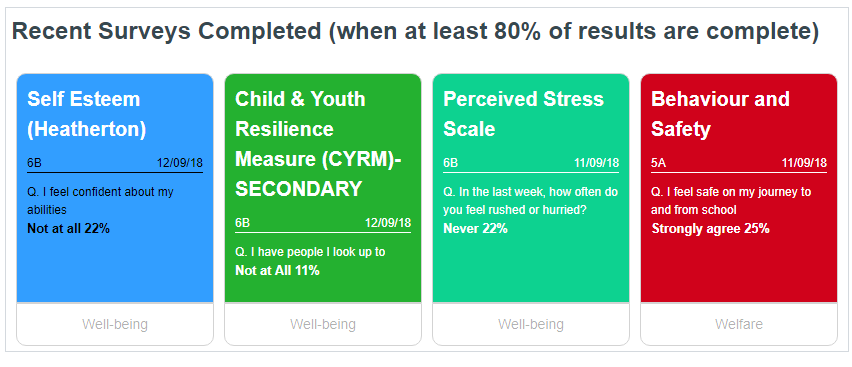
The last panel on this page shows you four of the last surveys that were completed. To view the full results of that survey, click on one of the items to see the results!