 Navigation
 Introduction
BounceTogether has been designed to make it easy for you to view and compare the results of completed surveys. This article demonstrates how you can navigate the platform to view the results of a survey you have assigned to a group of users. If you want to have even more oversight of the results and run comparisions between groups/classes, check out the Dashboard.
Preparation
Before you can view the results of a survey your users have taken, you must be logged in as a user that has permission to access the results of a survey. Only Staff or Admin level users can view this information for an entire class.
If you have forgotten your login credentials, you may need to speak to your BounceTogether Administrator to gain access again.
Results Console
You are now ready to look at the results of a survey!
- To view the full results from a survey, click Survey / Survey Results from the top menu.
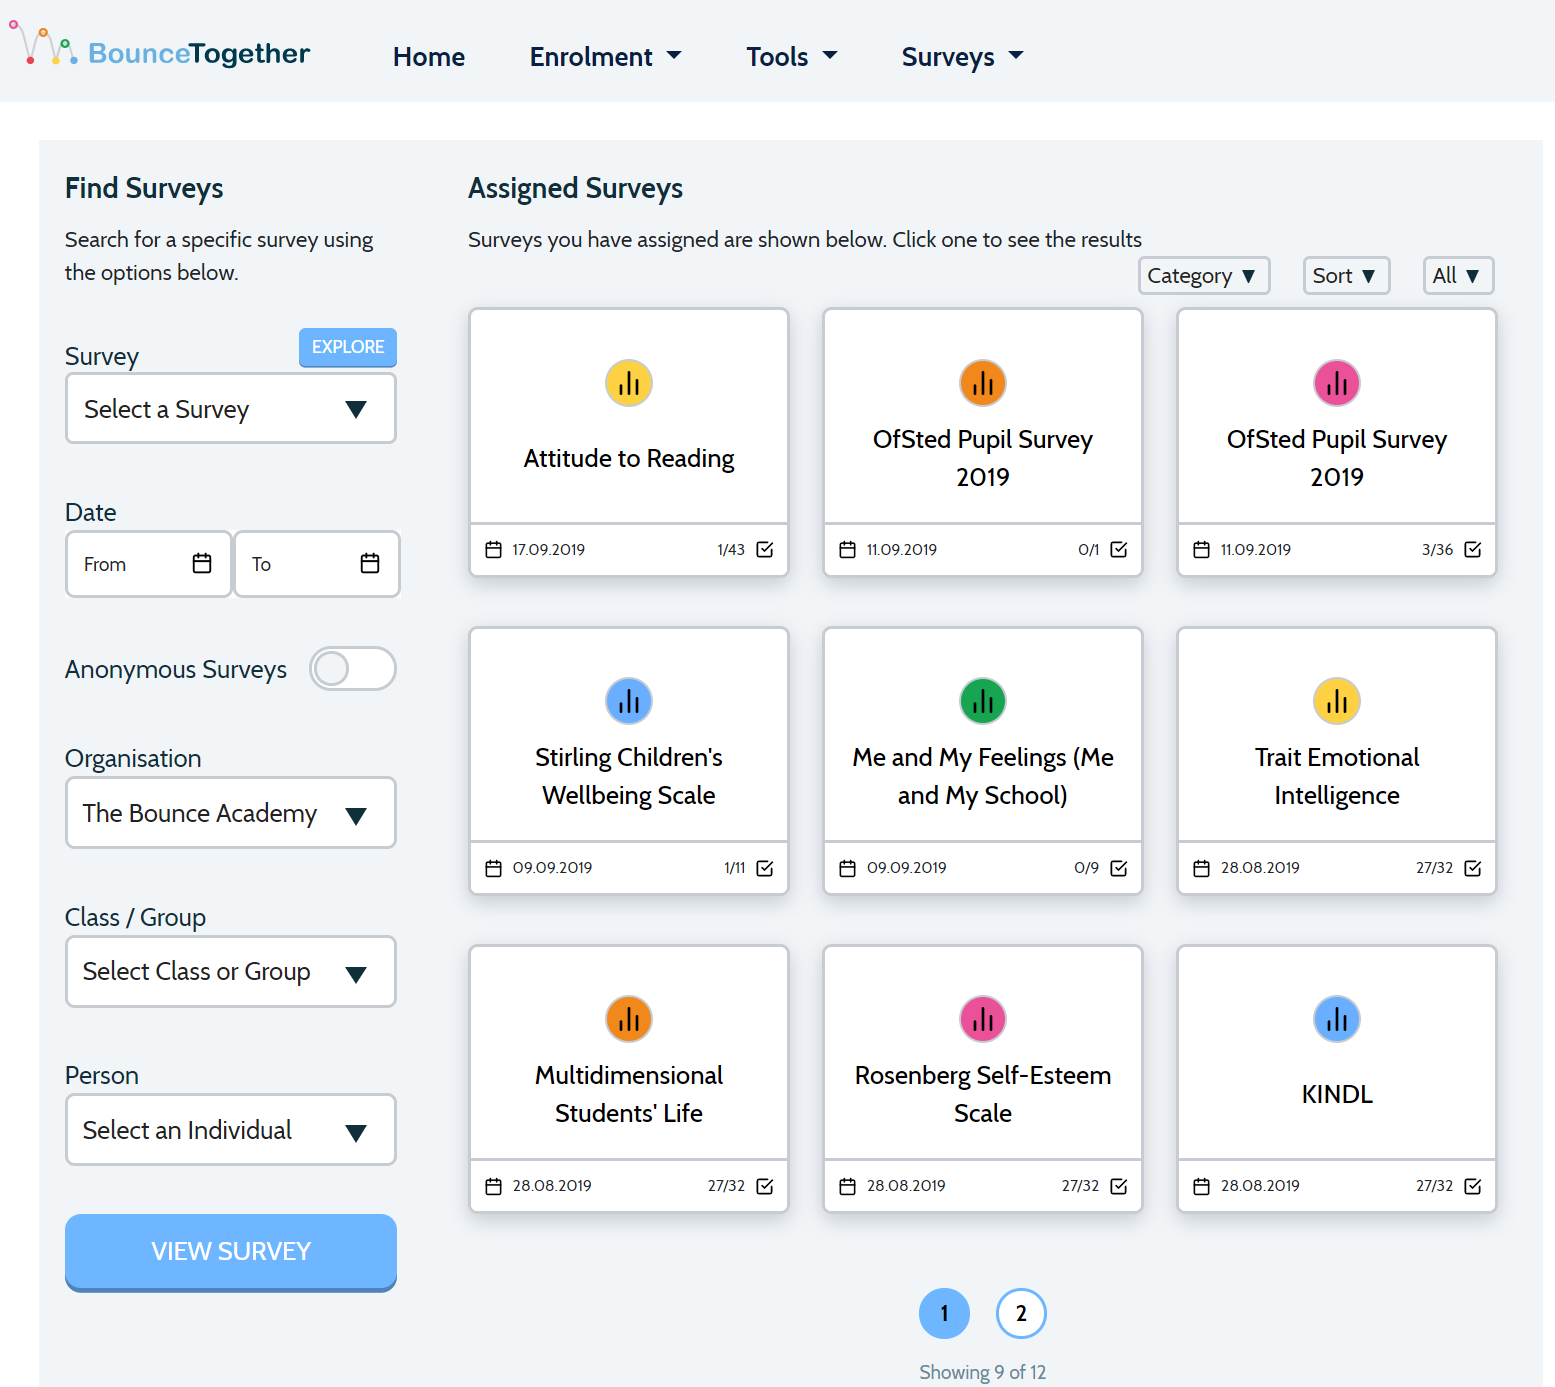
- The main Survey Results screen will open. On this screen, you will are able to search for a specific survey you have run in your school or you can choose one from the 'tiles' on the right.
- By default, these 'tiles' show you all surveys that you have run in school. You can sort and filter them, using the drop down menus on the top right.
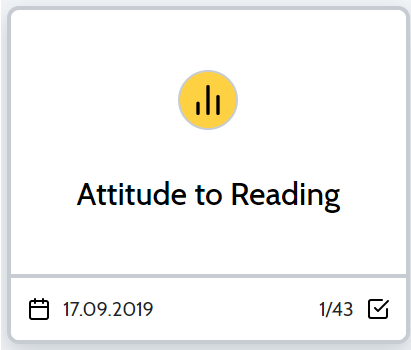
- Each tile will show you the survey that was assigned, when it was assigned and how many respondents the survey was assigned to. In the example below, the survey is "Attitude to Reading", assined on the 17th September 2019 and there has been 1 out of 43 eligible respondents.
- If you want to see the results of a survey in the list, just click on the tile! Alternatively, you can use the left menu to find a survey you have run in school, between two dates.
Category choosing a category will filter the results based on the category that survey fits into.
Sort lets you re-arrange the order in which the tiles are displayed. For example, you can see the newest first or sort them A to Z.
All The anonymous drop down lets you flick between surveys that have been assigned anonymously or ones where you will be able to see the results by pupil.
View the Results
In the results of a survey, you can see a question-by-question breakdown of the users as part of your survey have answered each question. At the top of this area, the question you are looking at is shown.
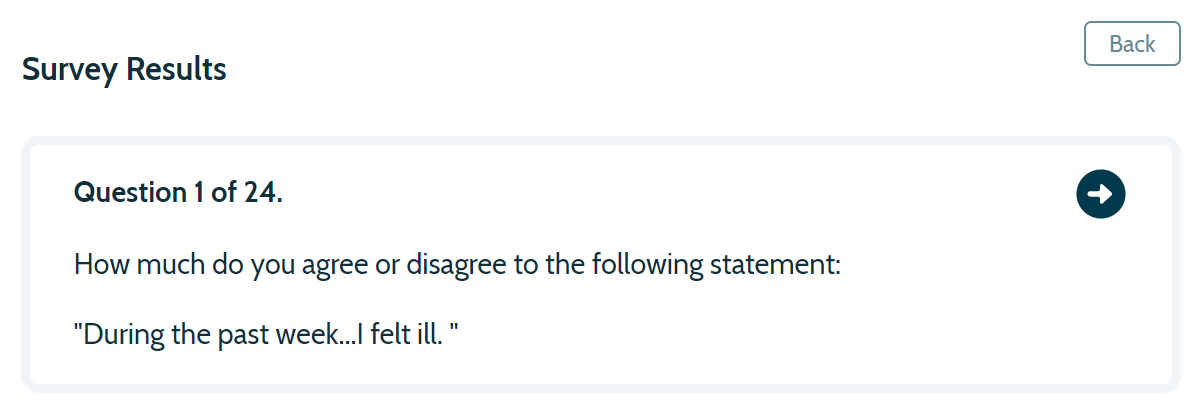
You can move through the questions in the survey using the arrows at the top right of this box. When you do this, the results for that question will change. Let's look at that bit next...
The next part of the results page is split into 2 parts; a chart and a grid. The chart is shown first with the data summarised underneath.
By default, the pie chart will show expressing the data as percentages per response option (e.g. "sometimes", "All of the time", "never" etc).
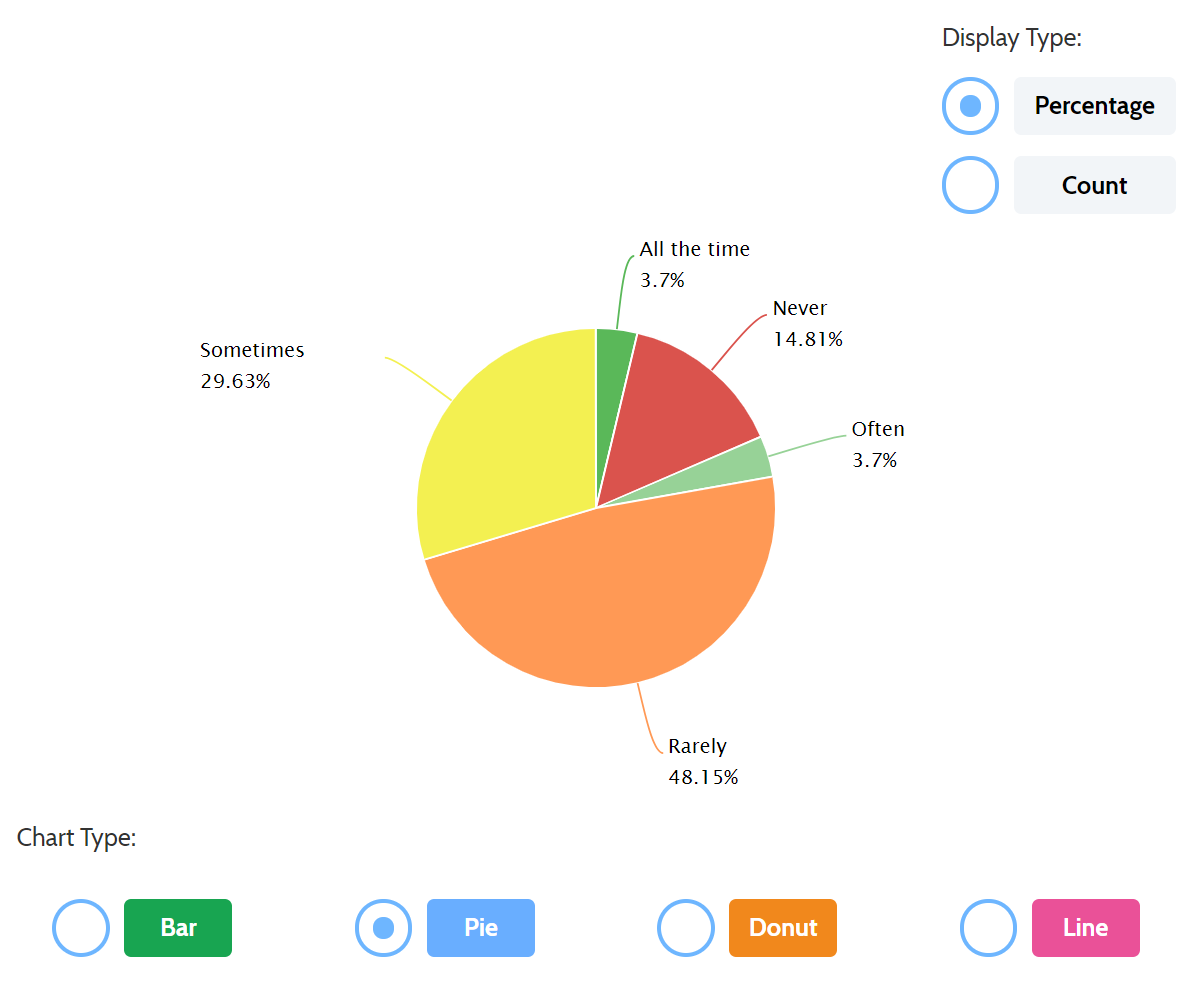
You can change whether the results show as a percentage or as a count! Click Percentage or Count to toggle between the two. The chart will update when you click.
It gets better! You can change the chart type that is shown. Click one of the four options to change the chart type; Bar, Pie, Donut and Line.
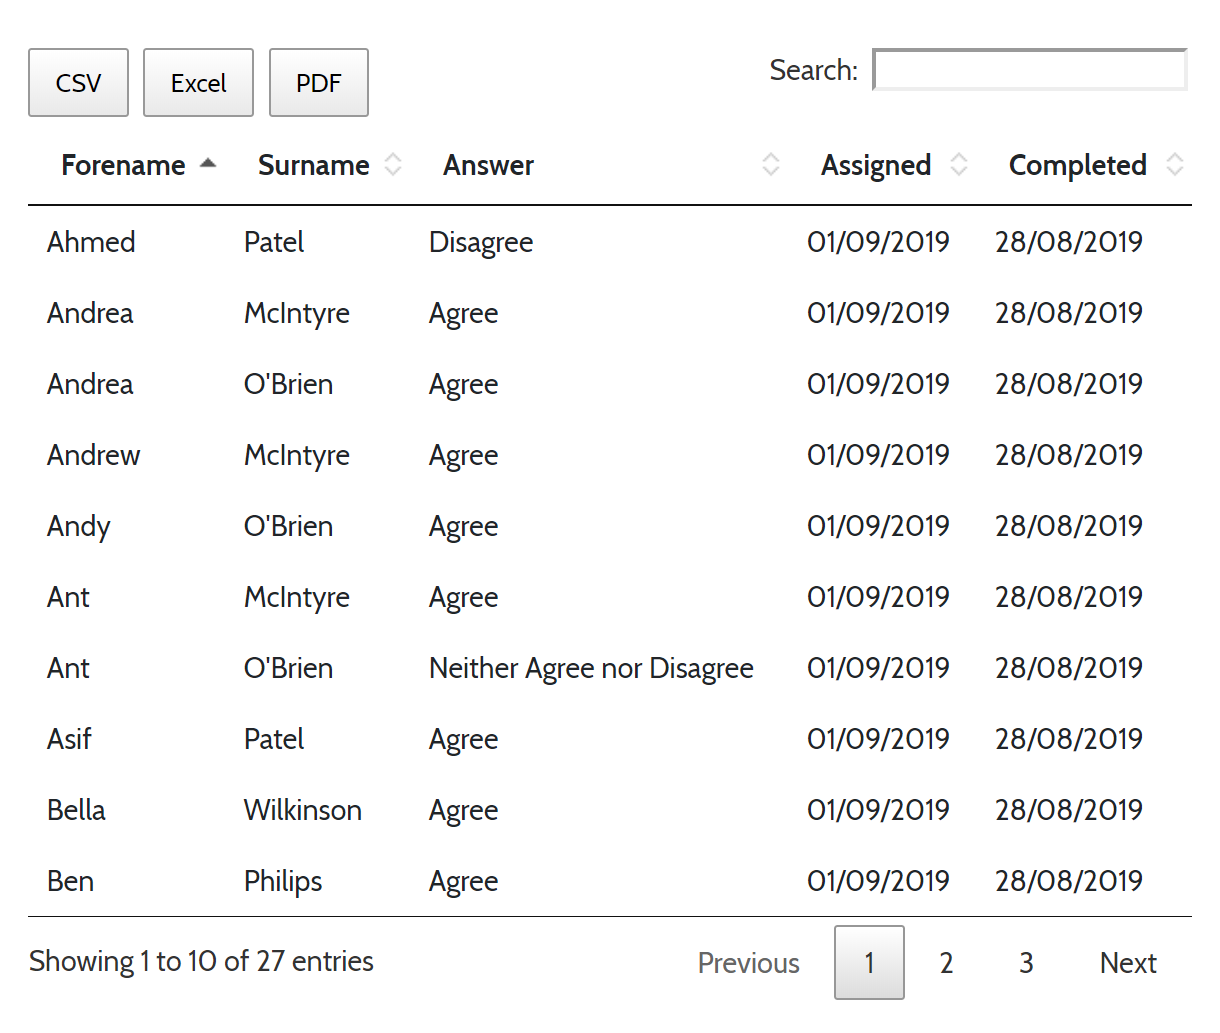
Underneath the chart, a grid that shows each individuals response is shown.
Note
This grid is only populated in cases where you haven't assigned an Anonymous survey! If you have, all names will be shown as "anonymous user".
Filtering
The Filter menu on the left will show you a summary of the survey as it is displayed. From this menu, you can filter the results that are displaying on the right. For example, you might want to only see the results for a particular class or, combine the results with another instance of a survey to amalgamate them.
Select one of the options for how you wish to filter the results then click Update Result to update them on the right. For example, if you
wanted to only show results from class "5A", you would select that from the Class/Group drop down then click
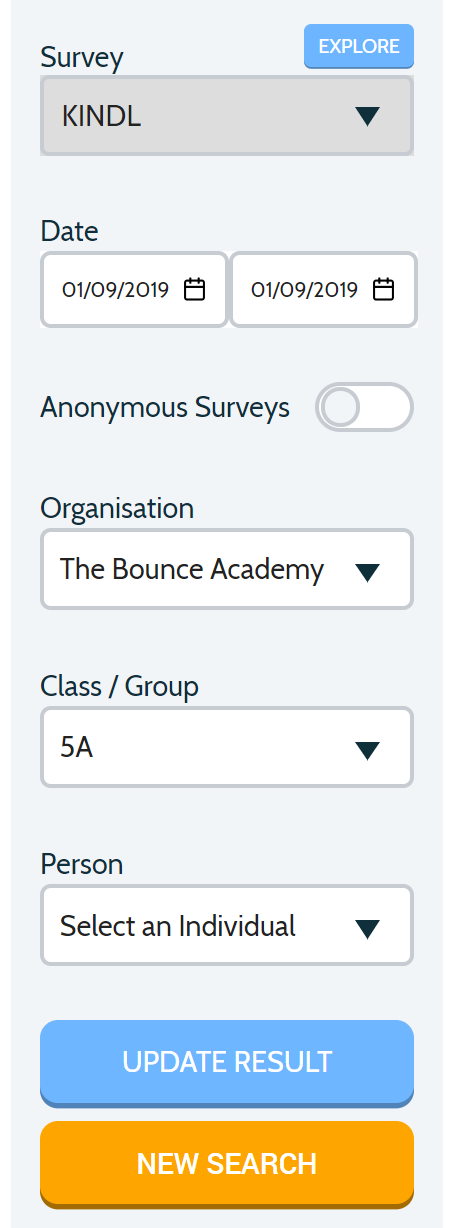
The Survey and Anonymous Survey options on the left menu are not editable and are shown to reflect how the survey has been assigned.
Export and Report
Above the grid, you have the option to Export the results to PDF, CSV or Excel. Clicking on the appropriate button will export data for that survey, not just the question you are viewing. If you have applied a filter to the results then it will only export the data relevant to your filter.
The Run Report is found underneath the grid. Clicking this button will show you a A4-style report for the survey. Some of the surveys in Bounce have reports at additional levels, for example, at group level. To run a report and only output the data for a specific group, select the group on the left menu (be sure not to click "update"!) then click Run Report.
Next to the run report button is Run Tabulated Report. Clicking this will produce a tabulated/pivoted summary of the entire results, for each question and individual. Click the button to see your results expressed in an entirely different way!